
- Cash game data for all major online poker networks and markets is accessible to PRO Data subscribers directly in the web app.
- Traffic indicators show recent changes for every network.
- Networks can be filtered by market, and data can be switched between 7-, 30- and 90-day moving averages.
- Up to two years of data an be graphed and compared.
A subscription to Poker Industry PRO Data gives you unique access to graphs of cash game traffic across all major online poker networks and markets, updated with the latest information every day.
Using data from PokerScout, recognized as the authority for independent online poker market tracking and reporting, Poker Industry PRO gives unprecedented access to compare markets and analyse trends—all from your web browser, tablet or mobile phone.
From the PRO Data homepage, you can:
- Get a quick-glance look at changes over the last seven days for all networks.
- Look at overall cash game traffic for all sites, or in a specific market.
- Compare up to five poker rooms or markets together.
- Analyse cash game traffic using either absolute or relative scales.
- Switch between 7, 30 and 90-day moving averages.
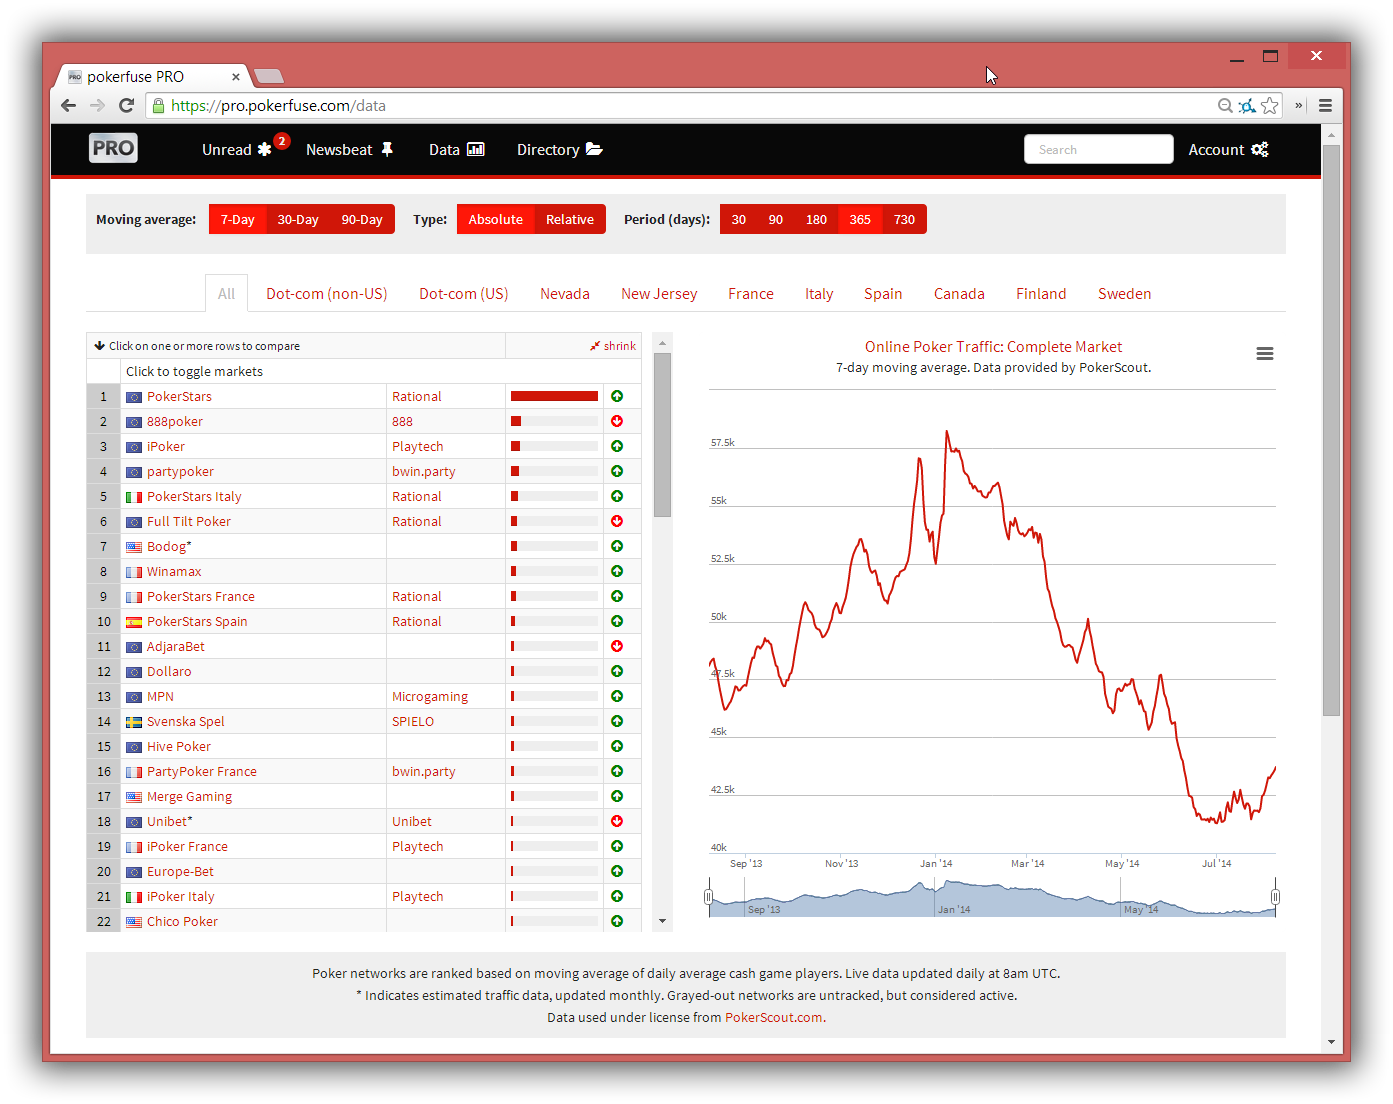
The Default Data view
PRO Data is accessed from the main menu item “Data” at the top of every PRO page.
The default Data view lists each poker network for which traffic is tracked in a column on the left hand side, with a main graph showing global cash game traffic over the previous 30 days.
Networks are ranked by their average cash game traffic, and can be selected individually or up to five at a time to compare.
Filters and switches at the top further customize the display. A “shrink” link reduces the width of the network list, giving more room for the graphing on the right hand side.
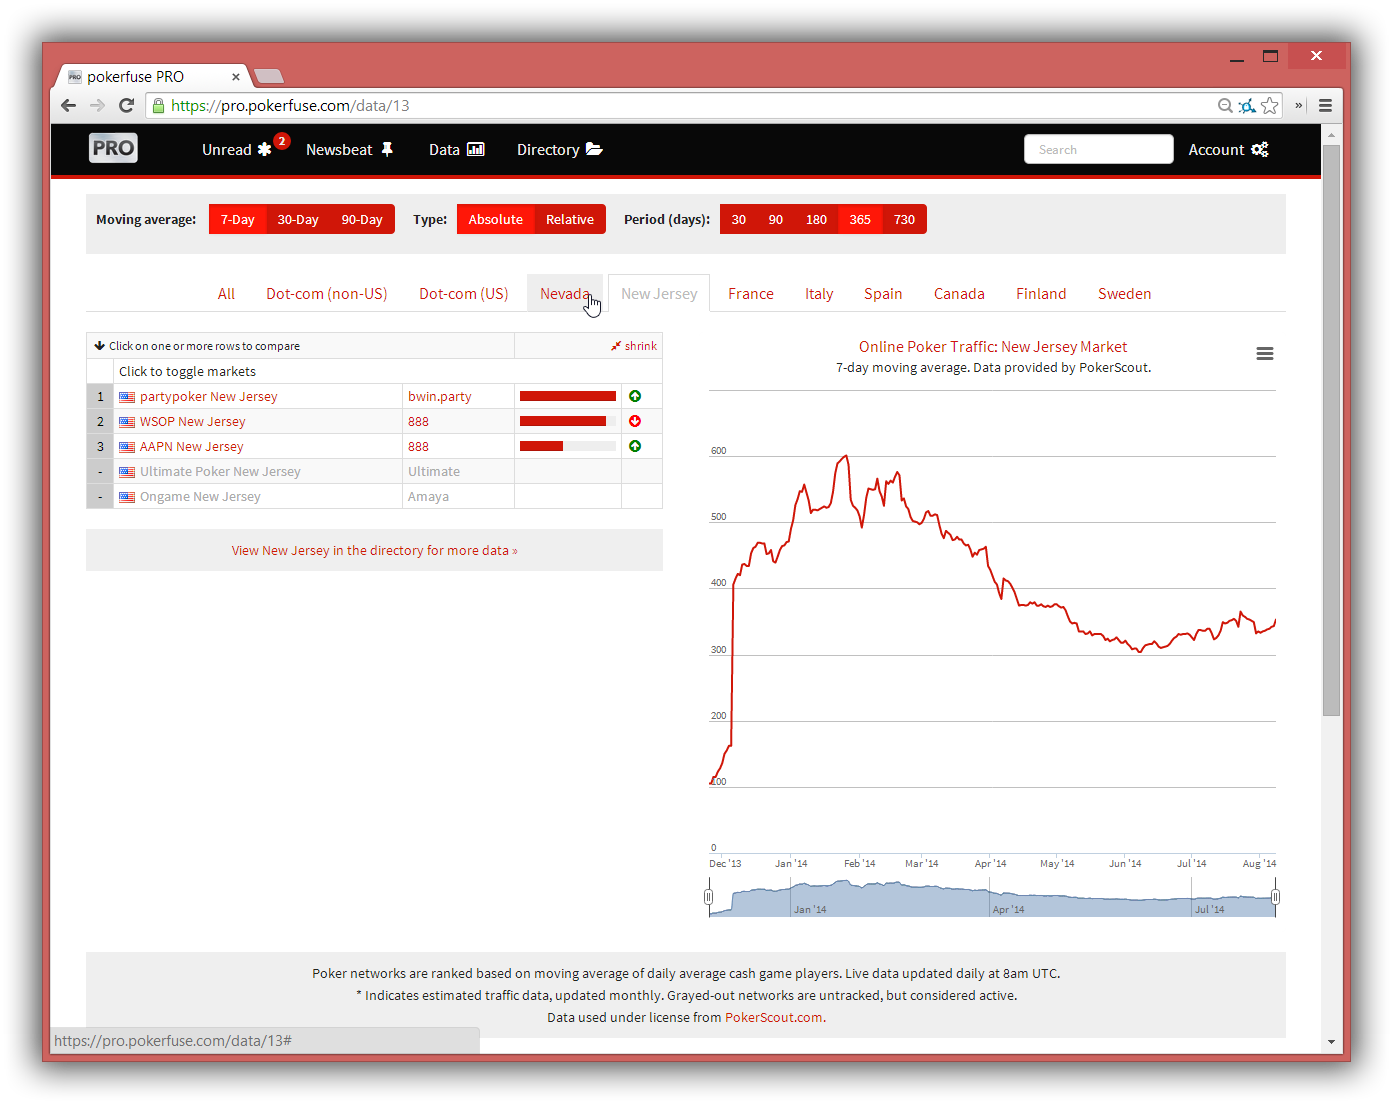
Switching Markets
Tabs along the top switch the view to specific markets, including “Dot-com (non-US)” (offshore licensed poker networks that have withdrawn from the US market), “Dot-com (US)” (networks that continue to serve some or all US states with a remote gaming license), and segregated-market player pools, including the newly-regulated US markets.
There are tabs for every country where more than one online poker network operates a segregated player pool.
Some single-network markets, like Delaware, are not listed, but the network itself can be found in the All list.
Traffic Indicators
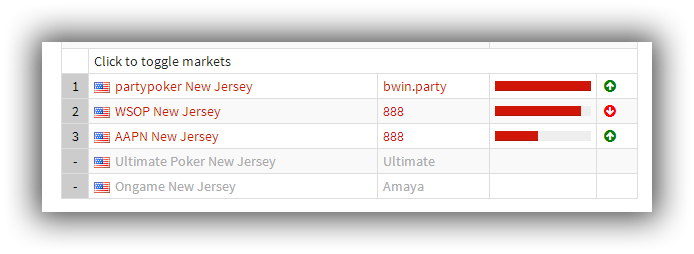 Next to each network, there are two indicators—a small relative traffic bar chart and an indicator arrow.
The bar graph shows a network’s traffic compared to the leader of the selected market. In the default All view, PokerStars represents a full bar, and all other networks are displayed relative to that.
In a country market, like New Jersey (shown), graphs update to show traffic relative to the leader—here, partypoker.
Up or down arrows next to the graph give a quick-glance look at recent traffic gains and drops. A green up arrow indicates that traffic today is greater than one week ago; a red down arrow identifies declining traffic.
Moving Averages
By default, the 7-day moving average is used for graphing and ranking of networks. This looks at the daily average over the last 7 days, matching the same canonical ranking published on PokerScout.com.
An option at the top lets you switch to a 30-day or 90-day trend. These comparisons are less affected by short-term traffic changes, such as those that result from temporary promotions. This can give a better idea of long-term trends on a monthly or yearly cycle.
Note that the moving average will affect all aspects of the data page—including the ranking of the networks, the red/green tick, the mini-charts, and the graphing.
Periods
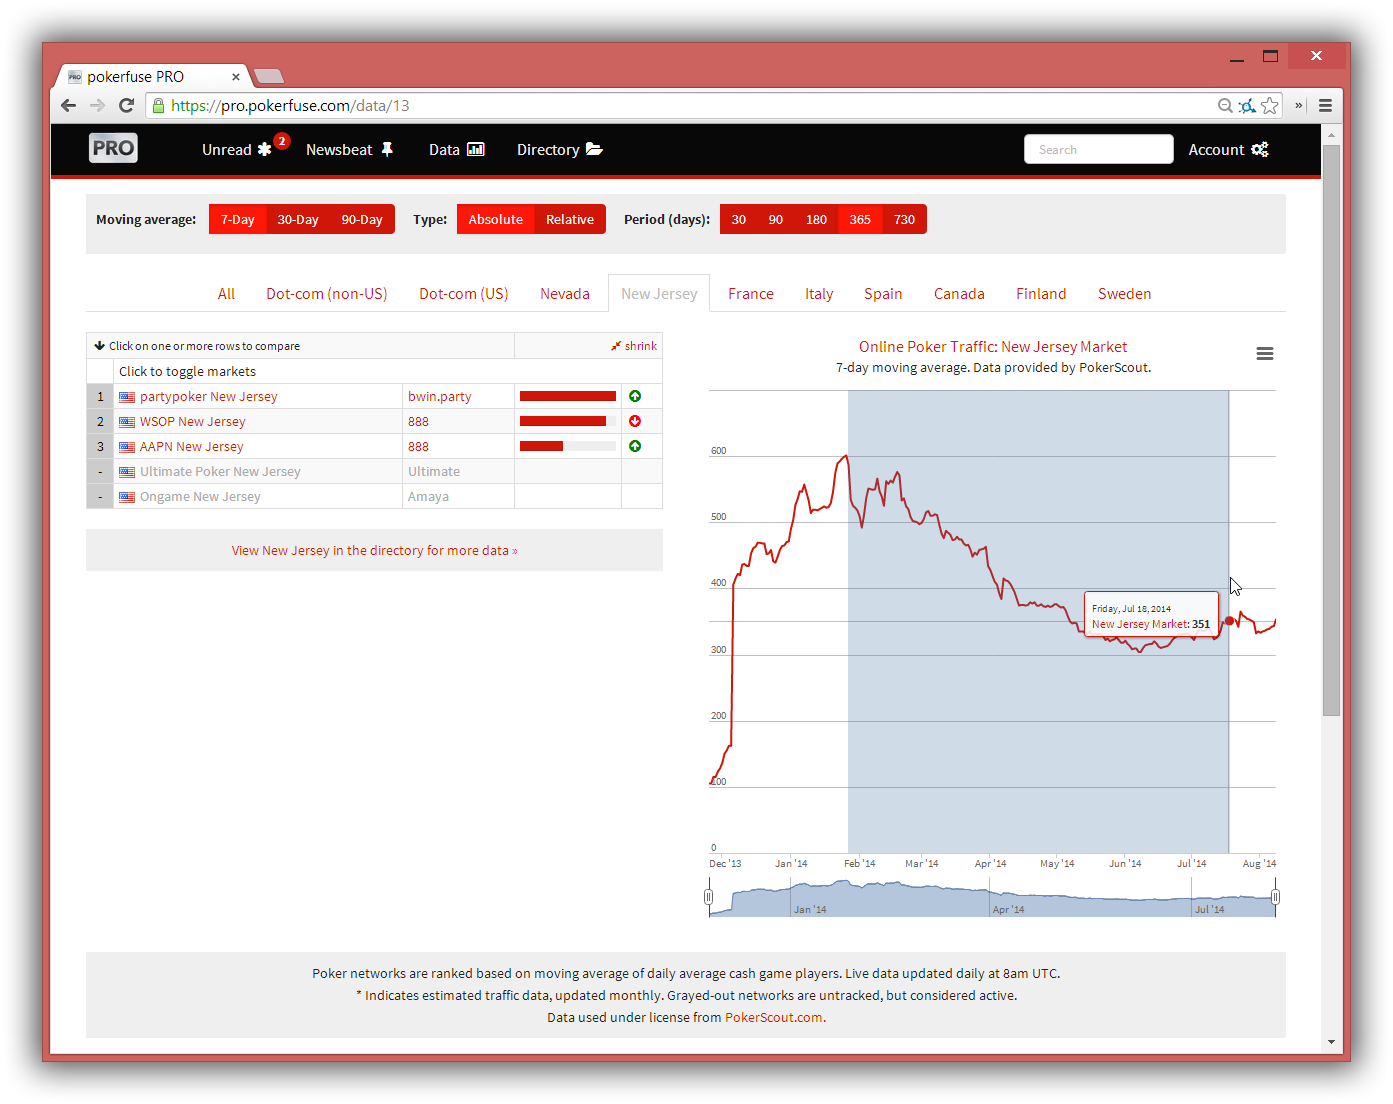
Up to two years of data can be displayed, using the Period switch at the top. Changing the period is immediately reflected in the graph below.
The time period can be further refined on the graph. You can click and drag to reduce the area, or use the sliders below the graph for more precise changes.
This brief introduction only scratches the surface of what is possible with a PRO Data subscription—in the next installment, we’ll look at relative graphing, selecting individual networks, and comparing networks and markets.
